
Salt Insight ~ Quality Reflections: C=0: How Zero-Defect Sampling Lowers Your Costs While Raising Your Standards.
In medical device manufacturing, traditional AQL (Acceptance Quality Limit) sampling standards (such as GB/T 2828.1) allow for “Acceptance Number Ac > 0,” which means that statistically, we implicitly accept the existence of a “certain proportion of defects.” But does this truly align with the paramount principle of patient safety? This article will conduct an in-depth analysis of Nicholas L. Squeglia’s C=0 (zero-defect) sampling plan, exploring how to significantly enhance quality risk control capabilities while reducing inspection costs, thereby achieving true “zero-defect” quality management.
Introduction: An Ethical Quandary about “Probability”
I. Why Say “No” to “Ac > 0”?
The long-established sampling standards (such as GB/T 2828.1) originated from wartime military procurement during World War II. Their core logic is the Acceptance Quality Limit (AQL), aimed at protecting the interests of producers by ensuring that batches meeting a certain quality level are highly likely to be accepted.
However, this mechanism has obvious limitations in the medical industry:
- Ethical Risk: Ac > 0 sends a wrong signal that “a certain proportion of defects is acceptable.”
- Sample Redundancy: To maintain a high acceptance probability, traditional plans often require a large sample size, increasing the cost of destructive testing.
- Misleading Sense of Security: It conceals deficiencies in supply chain process capabilities.
II. Core Logic of the C=0 Plan: Protection Based on “Consumer Risk”
The C=0 plan developed by Nicholas L. Squeglia fundamentally changes the rules of the game. Instead of focusing on “ease for producers,” it anchors on the Lot Tolerance Percent Defective (LTPD), primarily controlling the risk of “consumers (patients/customers) accepting bad batches.”
Its core features are simple yet stringent:
- Constant Acceptance Number of 0 (Ac=0): Regardless of the sample size, if one non-conforming item is found, the entire batch is detained.
- Reverse J-shaped OC Curve: Unlike the flat acceptance curve of the AQL plan, the curve of the C=0 plan drops sharply. This means that as long as there is a slight fluctuation in batch quality, the probability of rejection soars. This forces suppliers to elevate their process quality to a level far superior to that required by the AQL.
III. Statistical Magic: Fewer Samples, Stricter Protection
Many engineers may wonder: “The C=0 plan usually involves a smaller sample size. Does this not lead to missed detections?”
The answer is no. The C=0 plan utilizes precise calculations based on the hypergeometric distribution, rather than the binomial distribution used in traditional plans. More importantly, it compensates for the reduced sample size through its extremely stringent acceptance criterion (Ac=0).
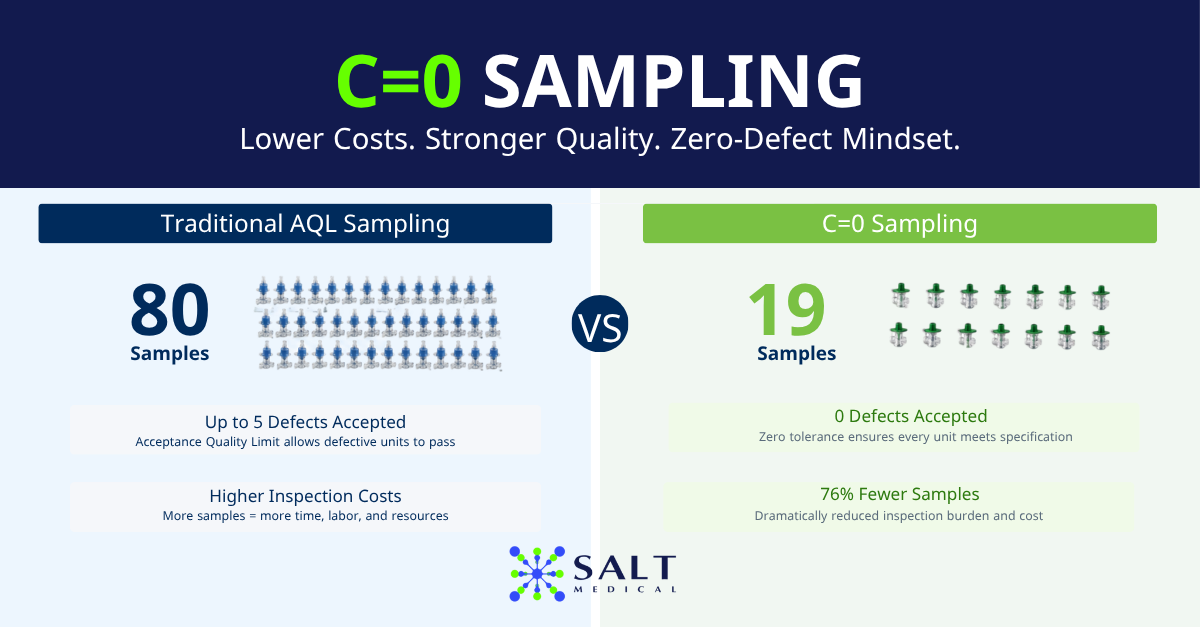
Comparison of Real-world Data (Taking AQL 2.5 as an Example):
| Batch Size Range | Traditional Plan(GB/T 2828.1)
General Inspection Level II,AQL 2.5 |
Result Determination | C=0 Plan (Squeglia)
AQL 2.5 |
Result Determination | Efficiency Improvement |
| 151 – 280 | n=32 | Ac=2, Re=3 | n=13 | Ac=0, Re=1 | Sample size reduced by59.3% |
| 501 – 1200 | n=80 | Ac=5, Re=6 | n=19 | Ac=0, Re=1 | Sample size reduced by76% |
The Result: For a batch of 1,000 units, we only need 19 samples instead of 80. However, those 19 must be perfect. This eliminates the compliance risk of “releasing a batch even though 5 defects were found,” which is technically allowed under traditional AQL.
As shown in Figure 1 below, a comparison of the Operating Characteristic (OC) curve shapes between GB/T 2828.1-2012 (General Inspection Level II, AQL 2.5) and the C=0 plan (Squeglia, AQL 2.5) is presented:
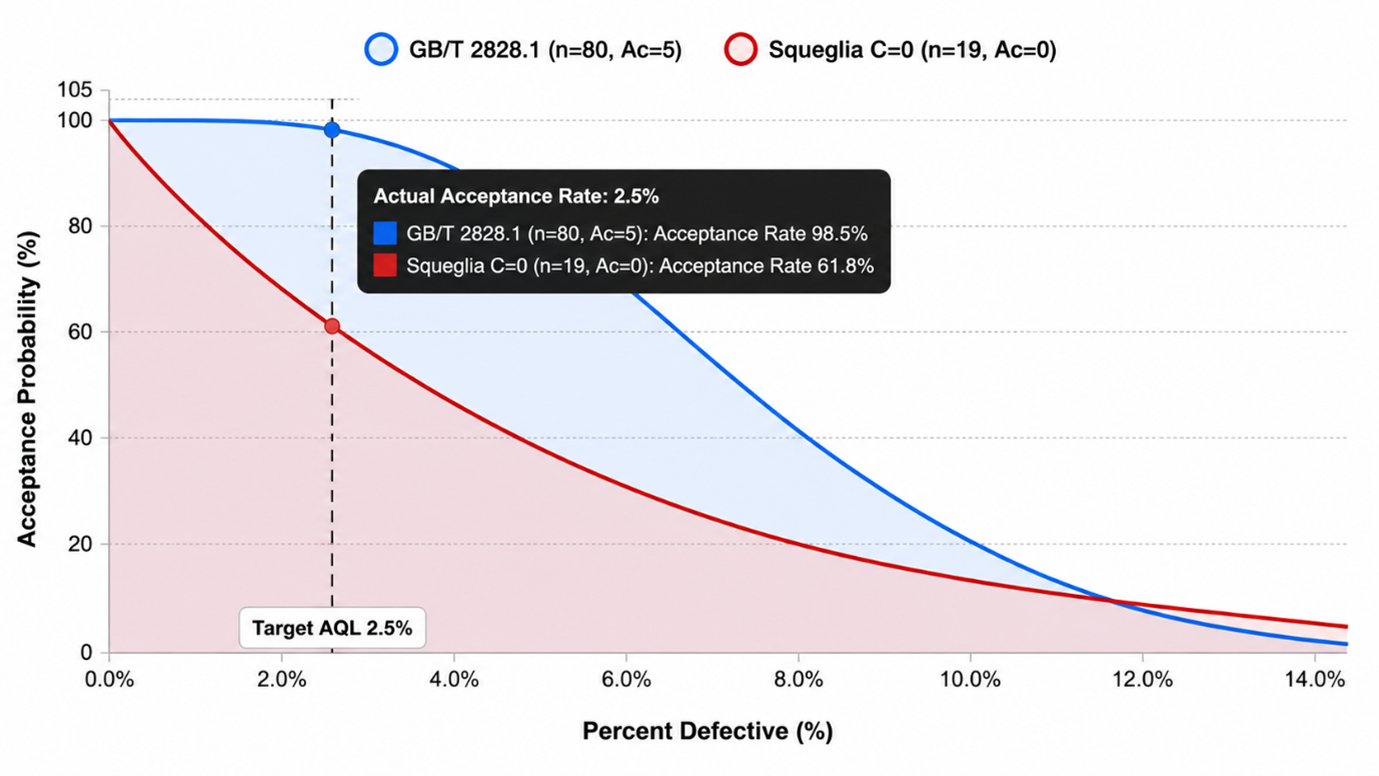
Graphical Analysis (AQL 2.5, Batch Size 501-1200)
- GB/T 2828.1 (n = 80, Accept 5, Reject 6):
The blue curve shows that at an AQL of 2.5% (indicated by the dashed line), the probability of acceptance is over 98%. Even when the actual non-conformance rate reaches 5.0% (double the AQL), the plan still has approximately a 78% probability of accepting the batch. This may be acceptable for minor defects, but for medical devices pursuing high quality, the risk remains significant.
- C=0 Plan (Squeglia, n = 19, Accept 0, Reject 1):
The red curve exhibits distinct characteristics. If a supplier’s actual non-conformance rate is exactly at the AQL of 2.5%, their probability of acceptance under the C=0 plan is only about 62% (meaning nearly 40% of batches will be withheld). To ensure continuous shipment (e.g., achieving an acceptance rate > 95%), the supplier must control the actual non-conformance rate below 0.27%. By reducing the sample size from 80 to 19, we not only lower inspection costs but also, through the deterrent of “zero acceptance,” force suppliers to improve their quality levels nearly tenfold.
IV. Salt Practice: The Wisdom from “Rejection” to “Withholding”
In Salt Medical’s quality management system, we do not merely apply the C=0 table mechanically but incorporate key management wisdom into our Standard Operating Procedures (SOPs).
4.1 Linking AQL Index Values
We still use AQL classifications (e.g., 0.65 for major defects and 2.5 for minor defects) to assess risks, but in the C=0 table, these serve only as “index values” for finding sample sizes with equivalent Lot Tolerance Percent Defective (LTPD) protection levels.
4.2 “Withhold” Instead of “Reject”
This is a crucial difference in our SOPs. When non-conforming items are found in C=0 samples, we define it as “withholding.” This means the batch enters the non-conforming product disposition process.
- Statistics tell us: This batch is not trustworthy.
- Engineering tells us: We need to eliminate this uncertainty through 100% screening or engineering evaluation.
This mechanism not only upholds the quality (bottom line) but also provides a scientific window for disposing of high-value materials in the supply chain.
Salt Medical’s implementation of the C=0 sampling plan is not solely aimed at cutting inspection costs but also at raising quality standards and fulfilling our commitment to a “zero-defect” quality policy. Through more scientific statistical tools, we are reshaping the quality DNA of the supply chain, ensuring that every product delivered to our customers meets rigorous standards.
References
- Nicholas L. Squeglia, Zero Acceptance Number Sampling Plans, Sixth Edition.
- GB/T 2828.1-2012 Sampling inspection procedures by attributes—Part 1: Sampling schemes indexed by acceptance quality limit (AQL) for lot-by-lot inspection.
- ISO 13485:2016 Medical devices—Quality management systems.
- FDA 21 CFR Part 820—Quality System Regulation.